Stock Market Free Demo Game


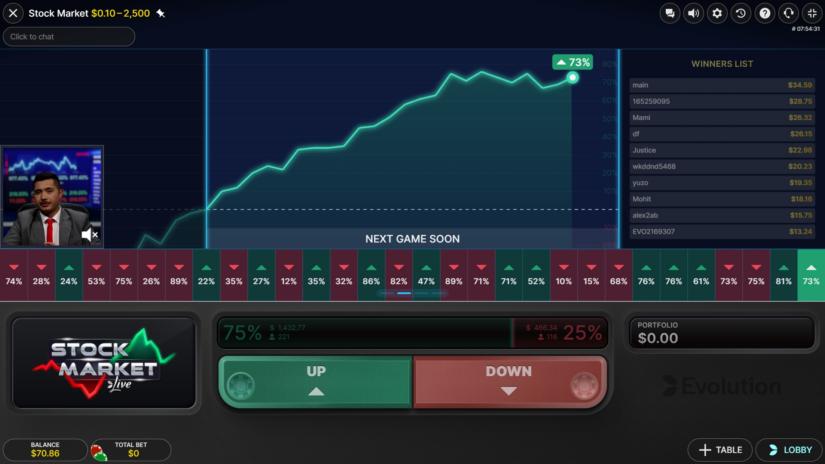
Stock Market is an exciting and fast-paced prediction game that combines the world of finance with live and first-person games. As a stock trader, join other players and try to predict whether a trading session (game round) will end above or below the initial value of a share. The change in value is shown in the form of a graph that rises and falls within up and down zones.
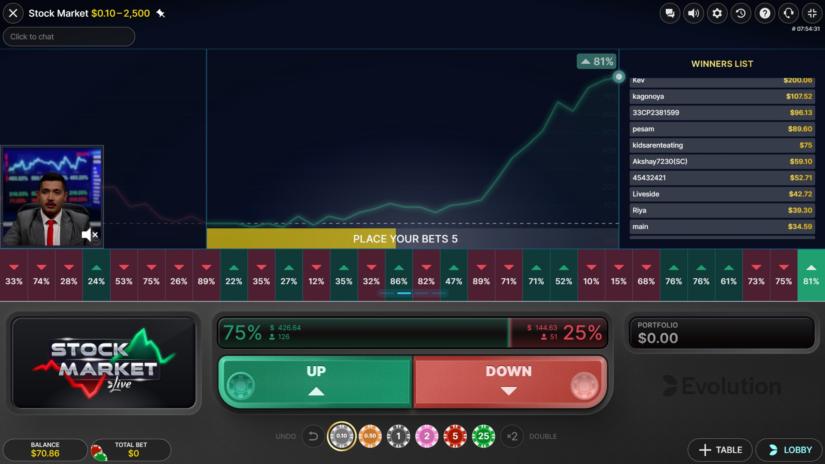
The game has two phases – a betting phase and a trading session. Bet on the up or down option. You cannot bet on both sides at the same time, but you can change sides as many times as you like between bets. Once your bet is accepted, it is added to your portfolio.

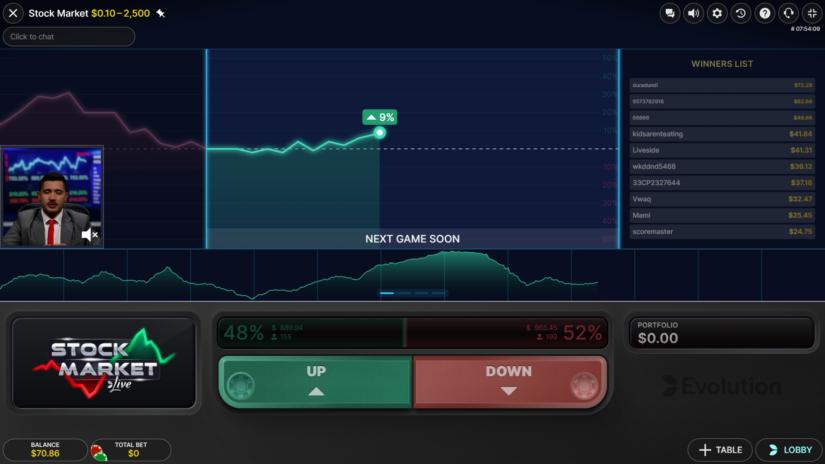
When the betting phase is over, the Trading Session will commence, and the stock value chart will start to generate. Before reaching a result, the chart will go through several interim values that will also be reflected in your Portfolio. This adds anticipation and thrill to the game but does not affect the result. All chart values are measured in percentages and calculated using RNG (Random Number Generator).
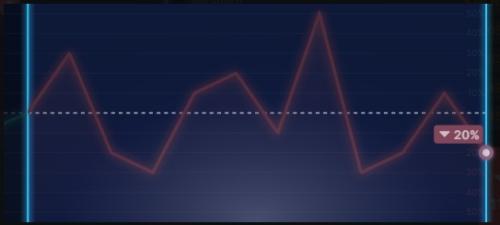
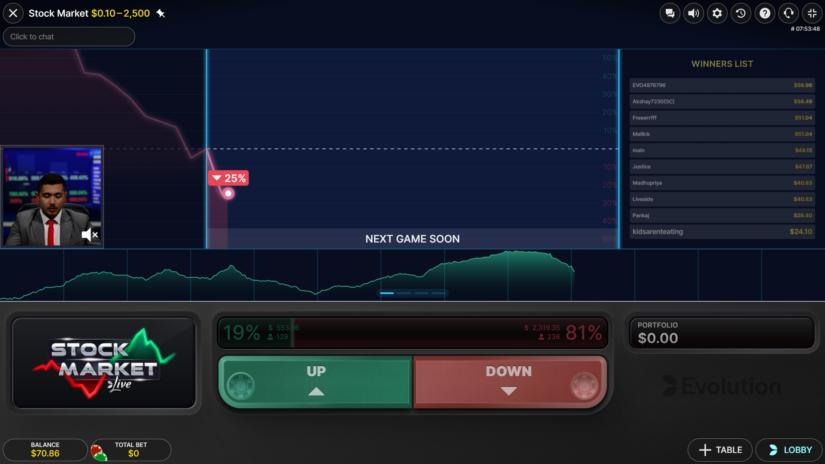
The outcome of the game depends on the value of the share at the moment the chart line touches the right border of the chart. The value can fluctuate between -100% and +100%, but will never land at 0% (i.e. it will always be positive or negative). The resulting value of the share affects the size of your portfolio by increasing or decreasing it.
Your Portfolio will always be rounded up or down to the nearest smallest unit of currency (e.g., eurocents for EUR, cents for USD, pennies for GBP, and no decimals for JPY) by generating a random number and comparing it with the portion of the Portfolio to be rounded off in order to determine the rounding direction.

See a more detailed explanation in the Rounding chapter.
When the round ends, a 1% commission fee is deducted from your Portfolio, and the remaining amount is cashed out to your balance.
Game results are recorded and presented to you in four different Result Statistics views. Results are provided sequentially from left to right, with the most recent result being the rightmost. Click/swipe the statistics to switch the Result Statistics view. The number of results you see on your device depends on which view is selected; it varies from 10 to 50 rounds.
Each cell in the Linear Chart view represents the chart build in a specific round, the same way as it is seen in the main chart area. For some devices, intermediate values can be omitted.

The overall colour of the chart changes based on whether the most recent resulting value is higher or lower than the starting value of the earliest round.
Here every cell shows the exact value reached in a certain round as a number. The colour of the cell reflects whether the round ended in Up or Down.

Each round is depicted as a candlestick. The colour of the candlestick shows whether the round ended in Up or Down. Its height reflects how big the resulting value was in its respective direction.

This view works exactly like the regular Linear Chart, but shows more previous rounds.

Your Portfolio will always be rounded up or down to the nearest smallest unit of currency (e.g., eurocents for EUR, cents for USD, pennies for GBP, and no decimals for JPY) using an RNG-based approach. This method introduces an element of randomness to the rounding process. Here’s how it works:
Example: Let’s assume that the number 500,000 is randomly generated in the second step. In this case, our example numbers would be rounded up or down as follows: 1.263 would be rounded down, because 300,000 is lower than 500,000, 5.23568696 would be rounded up because 568,696 is higher than 500,000 and 4.25034 would be rounded down because 34,000 is lower than 500,000.
